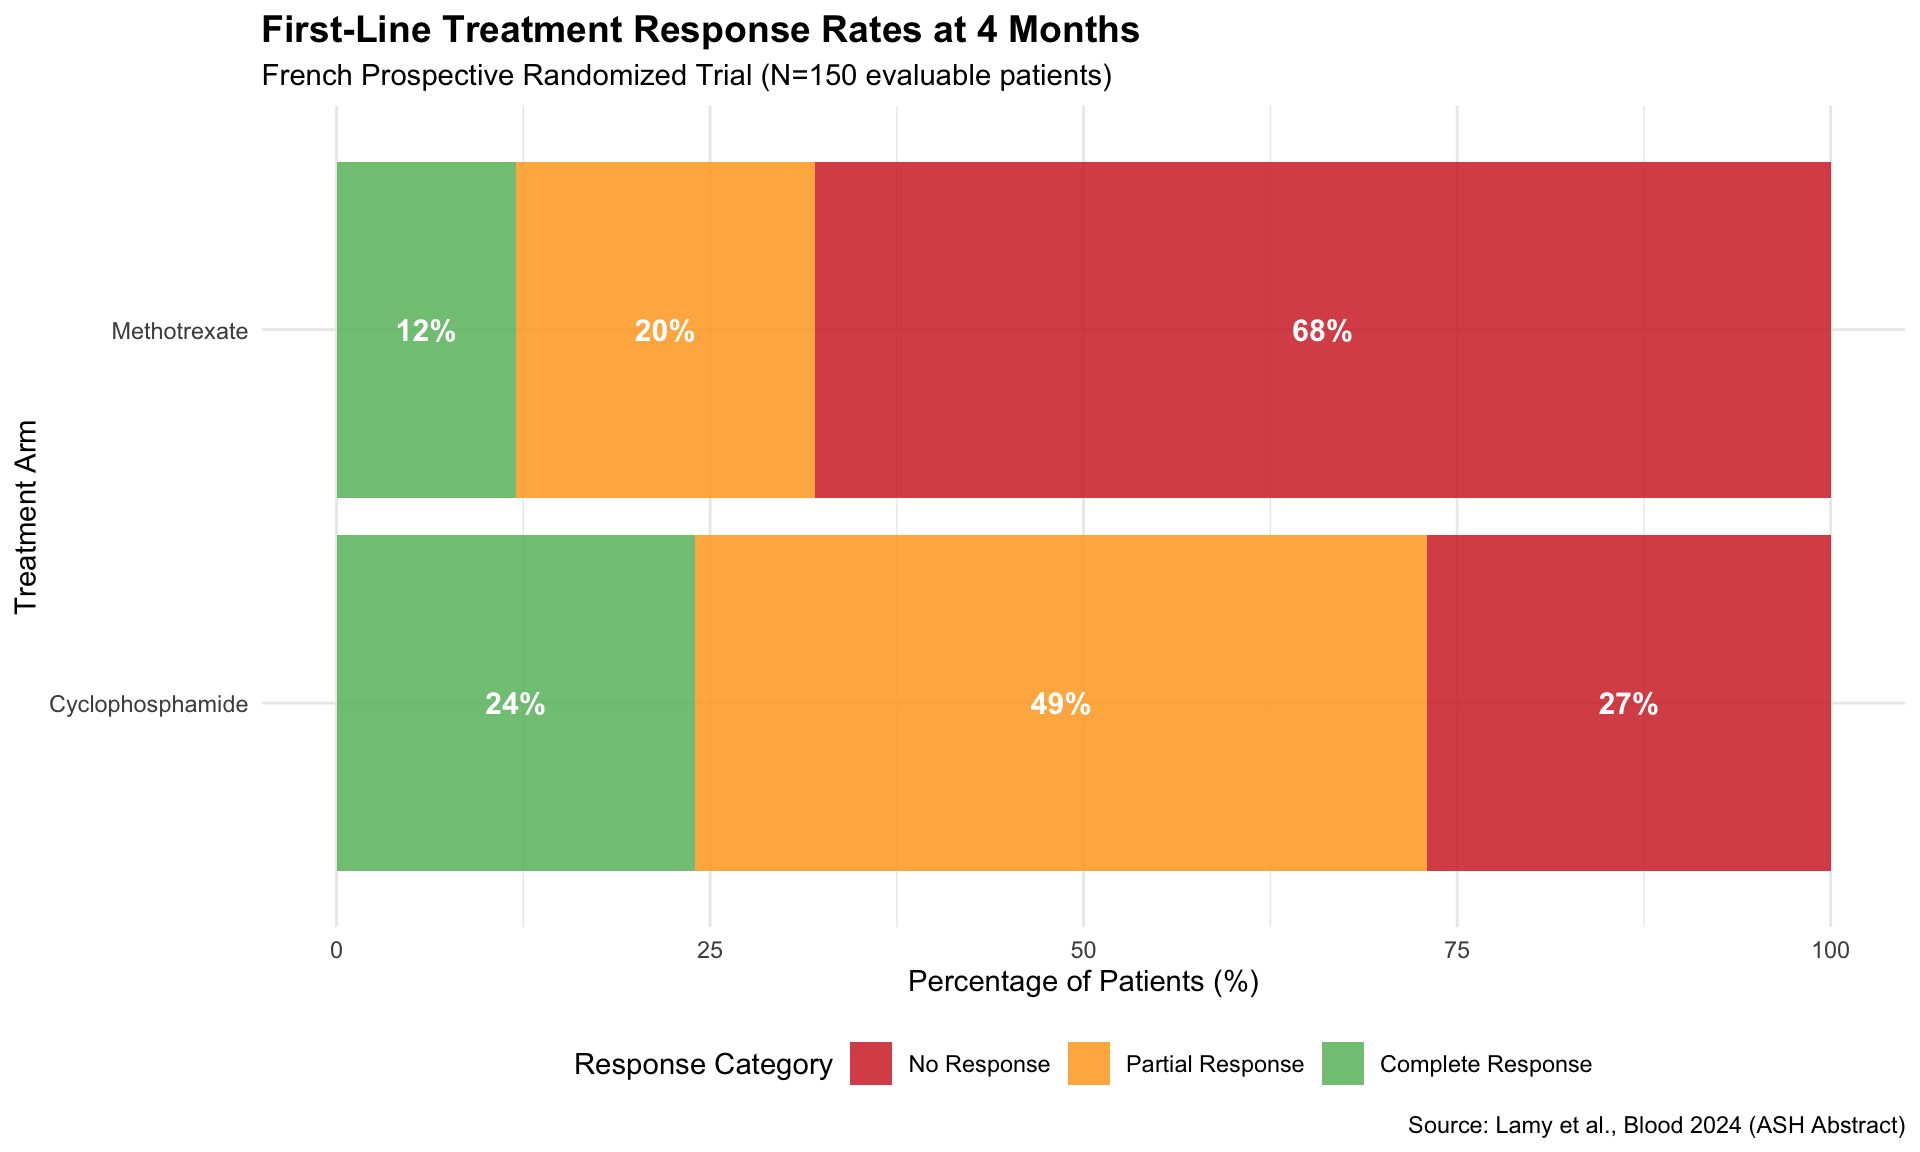
# Visualize trial results
response_data <- tibble(
  Treatment = rep(c("Cyclophosphamide", "Methotrexate"), each = 3),
  Response = rep(c("Complete Response", "Partial Response", "No Response"), 2),
  Percentage = c(24, 49, 27, 12, 20, 68)
)

response_data$Response <- factor(
  response_data$Response,
  levels = c("No Response", "Partial Response", "Complete Response")
)

ggplot(response_data, aes(x = Treatment, y = Percentage, fill = Response)) +
  geom_bar(stat = "identity", position = "stack", alpha = 0.85) +
  geom_text(
    aes(label = paste0(Percentage, "%")),
    position = position_stack(vjust = 0.5),
    color = "white",
    fontface = "bold",
    size = 4
  ) +
  labs(
    title = "First-Line Treatment Response Rates at 4 Months",
    subtitle = "French Prospective Randomized Trial (N=150 evaluable patients)",
    x = "Treatment Arm",
    y = "Percentage of Patients (%)",
    fill = "Response Category",
    caption = "Source: Lamy et al., Blood 2024 (ASH Abstract)"
  ) +
  theme_minimal() +
  theme(
    plot.title = element_text(face = "bold", size = 14),
    legend.position = "bottom"
  ) +
  scale_fill_manual(
    values = c(
      "No Response" = "#d32f2f",
      "Partial Response" = "#ffa726",
      "Complete Response" = "#66bb6a"
    )
  ) +
  coord_flip()